By English Test Coach · Updated
All sample answersAcademic Task 1 · 207 words
Library loans: distinguish recorded growth from forecasts
Compare the observed increases and predicted change in ranking while preserving the forecast status of the later figures.
Study the method: Line graphs: select trends and compare figures accurately →
Worked example: Distinguish observed library loans from projections →
Band 7 goal: Data comparisons
Develop and connect relevant ideas or select and compare the most useful details. This is a study route, not an examiner score assigned to the answer. How IELTS Writing is assessed.
The question
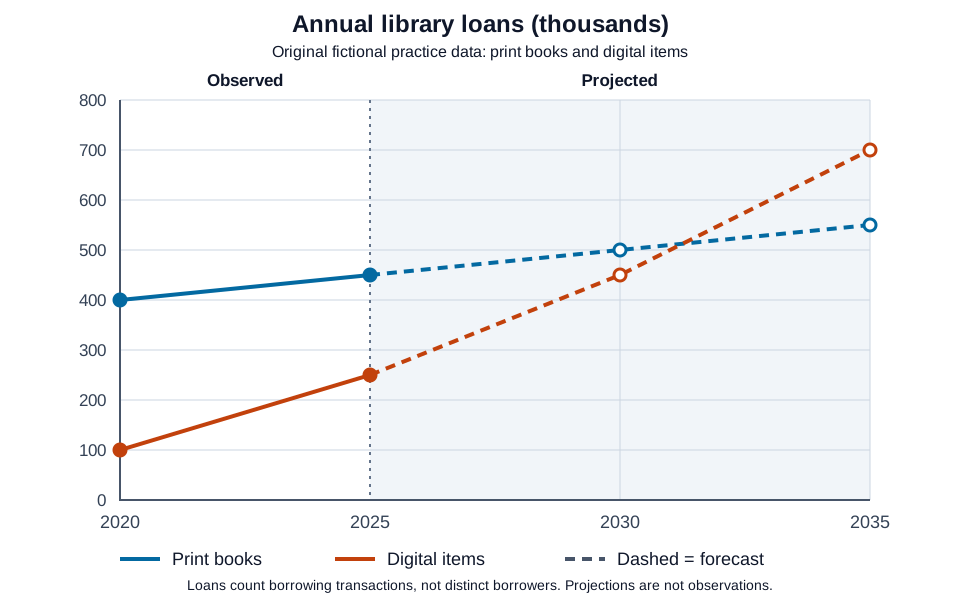
The line graph shows annual loans of print books and digital items from a town's libraries in 2020 and 2025, with projections for 2030 and 2035. Summarise the information by selecting and reporting the main features, and make comparisons where relevant.
 Open full-size diagram (new tab)
Read the chart data as a table
These figures belong to the original English Test Coach practice visual. They are fictional teaching data, not measured statistics about real places.
| Year and status | Print books | Digital items |
|---|---|---|
| 2020 (observed) | 400 | 100 |
| 2025 (observed) | 450 | 250 |
| 2030 (projected) | 500 | 450 |
| 2035 (projected) | 550 | 700 |
Solid lines and filled points show the two observed dates. Dashed lines, open points and the shaded area identify projections after 2025. A value of 400 represents 400,000 loans. These are borrowing transactions, not distinct people; no cause or exact annual crossover date is supplied.
The sample answer
The line graph compares annual borrowing of print books and digital items from a town's libraries. It presents figures for 2020 and 2025 and projections for 2030 and 2035, with loans measured in thousands.
Overall, both types of borrowing increased over the observed period and are projected to rise further. Print books accounted for more loans at both recorded dates, but digital borrowing is forecast to overtake print borrowing by 2035 after a much larger increase.
In 2020, print-book loans stood at 400,000, four times the digital total of 100,000. By 2025, the corresponding figures had reached 450,000 and 250,000. Digital borrowing therefore grew by 150,000 loans, compared with an increase of 50,000 for print books. Although print borrowing remained higher, the gap narrowed from 300,000 to 200,000 loans.
Print-book loans are projected to reach 500,000 in 2030 and 550,000 in 2035, continuing with gains of 50,000 between the displayed dates. The digital total is forecast to rise to 450,000 and then 700,000. Thus, digital borrowing would still be lower in 2030, by 50,000 loans, but would be 150,000 above the print figure in 2035. These projections indicate a reversal between the two forecast dates, without providing a separate annual observation for the exact point of crossover.
Vocabulary in context
Each phrase appears in the answer above. Learn how it works, not just a replacement word.
- are projected to
- Are predicted, on the basis of a forecast, to do something.
Use this for the later forecast values, not as evidence that the predicted change has already happened.
- the gap narrowed
- The difference between the two compared figures became smaller.
State or check the two differences: the observed gap here falls from 300,000 to 200,000 loans.
- is forecast to
- Is expected to follow a stated pattern in a prediction.
Keep the forecast status clear when moving from recorded digital loans to the later predicted figures.
Now make it your own
Write a different overview covering both series and the predicted ranking change. Then correct: 'Digital loans overtook print loans in 2031 because more residents bought tablets.' Separate what the source projects from the exact date and cause it does not supply.
For a smaller practice step, use the explanation, knowledge check and self-review exercise in Select and compare visual information.
The practice link opens the original question, not a copy of this answer.
Open the writing workspaceMore examples of this question type
Give an overview of the main patterns and support selected comparisons with accurate figures and units.