Academic Task 1 · 214 words
Household water: compare purposes and totals
Group three modest reductions against one large increase while keeping the unit and fictional data clear.
Study the method: Bar charts: compare categories and distinguish changes over time →
Band 7 goal: Data comparisons
Develop and connect relevant ideas or select and compare the most useful details. This is a study route, not an examiner score assigned to the answer. How IELTS Writing is assessed.
The question
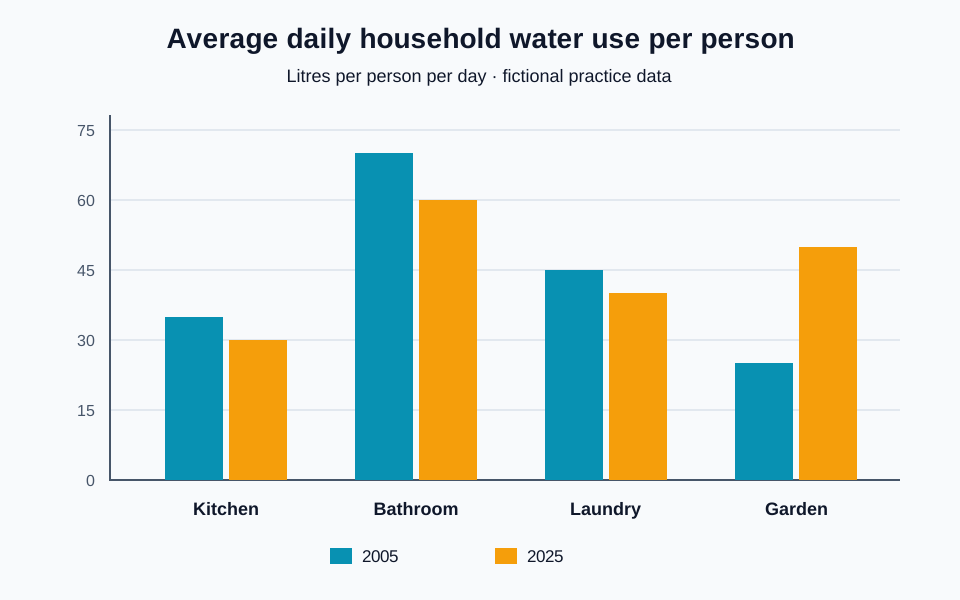
The bar chart shows average daily household water use per person for four purposes in a town in 2005 and 2025. Summarise the information by selecting and reporting the main features, and make comparisons where relevant.
 Open full-size diagram (new tab)
Read the chart data as a table
These figures belong to the original English Test Coach practice visual. They are fictional teaching data, not measured statistics about real places.
| Purpose | 2005 | 2025 |
|---|---|---|
| Kitchen | 35 | 30 |
| Bathroom | 70 | 60 |
| Laundry | 45 | 40 |
| Garden | 25 | 50 |
The measure is litres per person per day, not total town consumption. Garden use doubles while the other three categories fall; the visual does not supply reasons for those changes.
The sample answer
The grouped bar chart compares average daily consumption of water for kitchens, bathrooms, laundry and gardens in one town in 2005 and 2025. The figures are fictional practice data and are measured in litres per person per day.
Overall, bathrooms used the most water in both years. Consumption declined slightly in each of the three indoor categories, whereas garden use doubled and became the second-largest category in 2025. As a result, the combined total rose only marginally despite the reductions indoors.
Bathroom consumption was 70 litres per person per day in 2005, twice the kitchen figure of 35 litres. By 2025, these values had fallen to 60 and 30 litres respectively. Water used for laundry followed the same direction, decreasing by 5 litres from 45 to 40. Taken together, the three indoor purposes therefore accounted for 150 litres initially and 130 litres in the later year.
Garden use moved in the opposite direction. It rose by 25 litres, from 25 litres per person per day in 2005 to 50 litres in 2025, making it the only category to increase and placing it 10 litres below bathroom use at the end. Across all four purposes, daily consumption edged up from 175 to 180 litres. The chart does not indicate why households changed their water use.
Vocabulary in context
Each phrase appears in the answer above. Learn how it works, not just a replacement word.
- daily consumption
- The amount of a resource used during a single day.
Keep the full unit nearby because the chart reports litres per person, not the total for every household.
- rose by
- Increased by the difference between an earlier and a later value.
Use by for the amount of change: garden use rose by 25 litres and rose to 50 litres.
- edged up
- Increased by a small amount rather than rising sharply.
The phrase accurately describes the five-litre increase in the combined total, not the much larger garden change.
Now make it your own
Write a two-sentence overview without figures, then calculate how much the three indoor categories changed in total and explain why that did not reduce overall use.
For a smaller practice step, use the explanation, knowledge check and self-review exercise in Select and compare visual information.
The practice link opens the original question, not a copy of this answer.
Open the writing workspaceMore examples of this question type
Give an overview of the main patterns and support selected comparisons with accurate figures and units.