By English Test Coach · Updated
Academic Task 1 · Charts and data
Library loans: observations and forecasts
An original IELTS practice question with a planning route and a sample answer to learn from.
Aim for at least 150 words in about 20 minutes. Suggested practice level: advanced, not a predicted band.
Your writing task
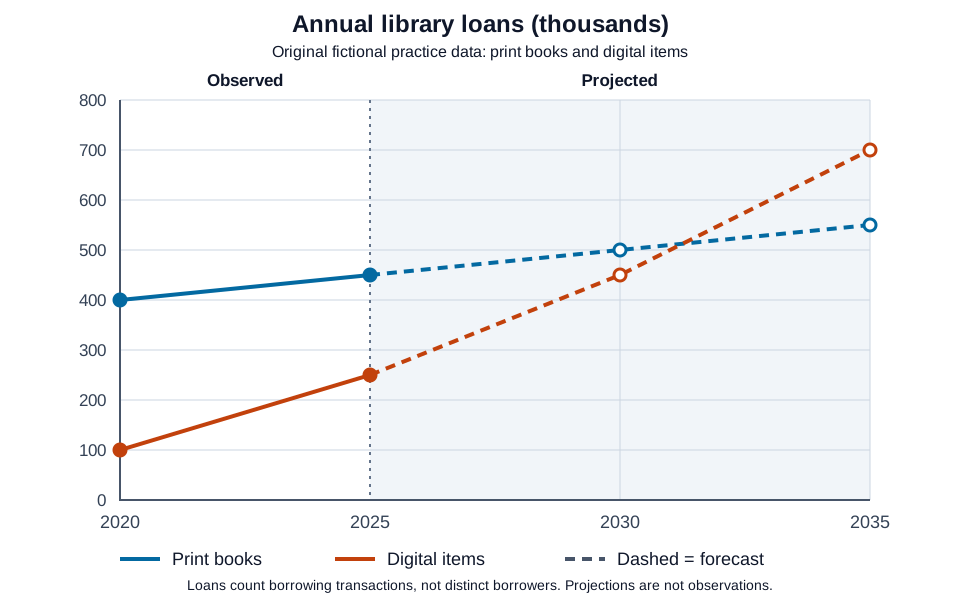
The line graph shows annual loans of print books and digital items from a town's libraries in 2020 and 2025, with projections for 2030 and 2035. Summarise the information by selecting and reporting the main features, and make comparisons where relevant.
 Open full-size diagram (new tab)
Read the chart data as a table
These figures belong to the original English Test Coach practice visual. They are fictional teaching data, not measured statistics about real places.
| Year and status | Print books | Digital items |
|---|---|---|
| 2020 (observed) | 400 | 100 |
| 2025 (observed) | 450 | 250 |
| 2030 (projected) | 500 | 450 |
| 2035 (projected) | 550 | 700 |
Solid lines and filled points show the two observed dates. Dashed lines, open points and the shaded area identify projections after 2025. A value of 400 represents 400,000 loans. These are borrowing transactions, not distinct people; no cause or exact annual crossover date is supplied.
How to approach this question
Give an overview of the main patterns and support selected comparisons with accurate figures and units.
Line graphs: select trends and compare figures accurately →
Worked example: Distinguish observed library loans from projections →
Overview: both loan series rose between the observed dates and are projected to rise further. Print books lead in 2020 and 2025, while digital items are forecast to lead by 2035. Preserve the distinction between recorded values and predictions.
Detail grouping: compare 2020 with 2025 first, then the 2030 and 2035 forecasts. The observed gap narrows from 300,000 to 200,000 loans. Digital loans remain below print in the 2030 projection but exceed them in 2035; no exact crossover year, cause or count of distinct borrowers is given.
These are possible directions, not required opinions or facts to memorise. Develop your own response and check every claim against the task.
A possible plan
- Introduction: identify what is shown, including the time period or stages where relevant.
- Overview: select the largest changes, main contrasts or overall process without inventing causes.
- Details 1: group related features and support them with accurate data, locations or stages.
- Details 2: cover the remaining main features and make relevant comparisons. Check units, dates and direction of change.
Vocabulary you can use precisely
Choose language that fits your meaning. You do not need to include every phrase.
- are projected to
- Are predicted to do something in a forecast.
Print-book loans are projected to reach 550,000 in 2035.
- the gap narrowed
- The difference between the compared values became smaller.
Between 2020 and 2025, the gap narrowed from 300,000 to 200,000 loans.
Ready to write your own answer?
The workspace opens with this question selected, not the sample answer. Plan, write and review your own response. Public AI assessments are currently paused; the writing and study tools remain available.
Start this writing task →