By English Test Coach · Updated
All sample answersAcademic Task 1 · 200 words
Commuting methods: comparing shares
Group a table by its main changes, distinguish percentages from percentage points and avoid inventing commuter totals.
Study the method: Table reports: compare shares, trends and rankings →
Band 7 goal: Data comparisons
Develop and connect relevant ideas or select and compare the most useful details. This is a study route, not an examiner score assigned to the answer. How IELTS Writing is assessed.
The question
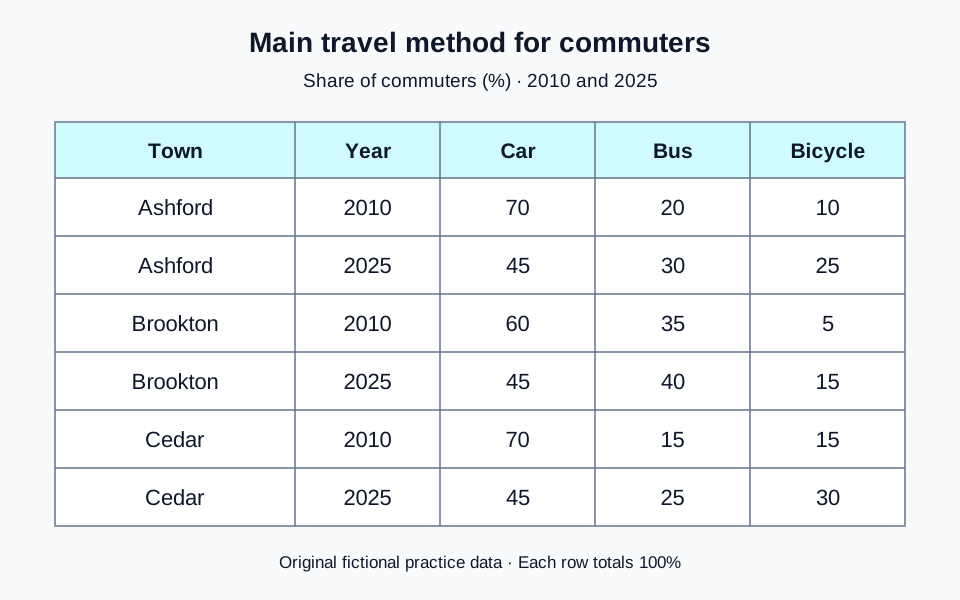
The table shows the percentages of commuters using three main methods of travel to work in three towns in 2010 and 2025. Summarise the information by selecting and reporting the main features, and make comparisons where relevant.
 Open full-size diagram (new tab)
Read the chart data as a table
These figures belong to the original English Test Coach practice visual. They are fictional teaching data, not measured statistics about real places.
| Town and year | Car | Bus | Bicycle |
|---|---|---|---|
| Ashford, 2010 | 70 | 20 | 10 |
| Ashford, 2025 | 45 | 30 | 25 |
| Brookton, 2010 | 60 | 35 | 5 |
| Brookton, 2025 | 45 | 40 | 15 |
| Cedar, 2010 | 70 | 15 | 15 |
| Cedar, 2025 | 45 | 25 | 30 |
Each town-year row totals 100%. These are proportions of commuters, so they do not establish how many people travelled by each method. A change from 70% to 45% is a fall of 25 percentage points.
The sample answer
The table compares the proportions of commuters travelling to work by car, bus and bicycle in Ashford, Brookton and Cedar in 2010 and 2025. The figures are percentages, with the three methods together accounting for all commuters in each town in each year.
Overall, the share using cars fell in all three towns, while the proportions travelling by bus and bicycle increased. Despite these reductions, cars remained the largest individual category everywhere in 2025, accounting for the same proportion of commuters in each town.
In Ashford and Cedar, car use declined from 70% to 45%, a fall of 25 percentage points. Brookton recorded a smaller decrease, from 60% to 45%. Bus travel was most common in Brookton in both years, rising from 35% to 40%. The corresponding increases in Ashford and Cedar were from 20% to 30% and from 15% to 25%, respectively.
Cycling gained ground in every town. Its share increased from 10% to 25% in Ashford and doubled from 15% to 30% in Cedar. In Brookton, it tripled from 5% to 15%, although this remained the lowest cycling share of the three towns in 2025. Cedar, by contrast, had the highest proportion of bicycle commuters at the end.
Vocabulary in context
Each phrase appears in the answer above. Learn how it works, not just a replacement word.
- percentage points
- The arithmetic difference between two percentages.
A fall from 70% to 45% is 25 percentage points, not a 25% relative decrease.
- the same proportion
- An equal share of each group's total.
Equal proportions do not establish equal numbers when the totals are not supplied.
- respectively
- In the same order as the items just listed.
Keep the towns and their paired figures in exactly the same order.
Now make it your own
Write a two-sentence comparison of bus and bicycle use in 2025. Use only figures from the table, then explain why the table cannot show which town had the most commuters.
For a smaller practice step, use the explanation, knowledge check and self-review exercise in Select and compare visual information.
The practice link opens the original question, not a copy of this answer.
Open the writing workspaceMore examples of this question type
Give an overview of the main patterns and support selected comparisons with accurate figures and units.